Get the complete outlook on today's hottest market trends.
|
|
|
| |
| |
| Get the complete outlook on today's hottest market trends. |
| |
|
|
|
|
|
|
|
|
| |
| |
 |
|
| |
| Technical Score |
 |
Short-Term |
 |
|
|
Medium-Term |
 |
|
 |
Long-Term |
 |
|
|
| Quant Rating |
 |
60 |
|
| Strong |
|
|
|
|
|
|
|
|
| |
| |
|
|
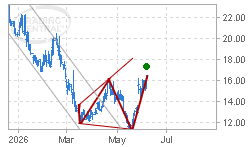
Megaphone Bottom
| 30% move possible
|
Trading closed at 16.22 to confirm an Intermediate-Term Megaphone Bottom pattern.
Tells Me: The recent broadening action tells us that trading has been out of control, but a breakout on the upside suggests we're starting a more decisive uptrend.
More Details
|
|
|
|
| |
|
|
| |
|
|
| |
|
|
|
|
|
| |
| |
 |
|
| |
| Technical Score |
|
Short-Term |
 |
|
|
Medium-Term |
|
|
|
Long-Term |
|
|
|
| Quant Rating |
|
63 |
|
| Strong |
|
|
|
|
|
|
|
|
| |
| |
|
|
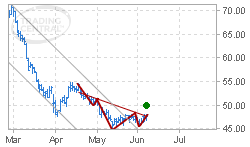
Head and Shoulders Bottom
| 11% move possible
|
Trading closed at 47.61 to confirm an Intermediate-Term Head and Shoulders Bottom pattern.
Tells Me: The price seems to have reached the end of a period of "accumulation" at the bottom of a major downtrend; the break up through resistance signals a reversal to a new uptrend.
More Details
|
|
|
|
| |
|
|
| |
|
|
| |
|
|
|
|
|
| |
| |
 |
|
| |
| Technical Score |
|
Short-Term |
|
|
|
Medium-Term |
|
|
|
Long-Term |
|
|
|
| Quant Rating |
|
59 |
|
| Strong |
|
|
|
|
|
|
|
|
| |
| |
|
|
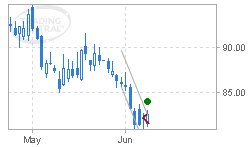
Engulfing Line (Bullish)
|
Trading closed at 82.64 to confirm a Short-Term Engulfing Line (Bullish) pattern.
Tells Me: The recent downtrend is due to reverse, now that buying pressure has overwhelmed prior selling pressure.
More Details
|
|
|
|
| |
|
|
| |
|
|
| |
|
|
|
|
|
| |
| |
 |
|
| |
| Technical Score |
|
Short-Term |
 |
|
|
Medium-Term |
|
|
|
Long-Term |
 |
|
|
| Quant Rating |
 |
21 |
|
| Very Weak |
|
|
|
|
|
|
|
|
| |
| |
|
|
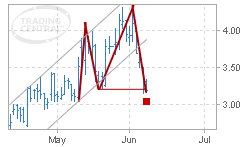
Double Top
| 35% move possible
|
Trading closed at 3.19 to confirm an Intermediate-Term Double Top pattern.
Tells Me: The price seems to have reached a top, after failing to break through a resistance level and ultimately breaking downward in a sign of reversal to a new downtrend.
More Details
|
|
|
|
| |
|
|
| |
|
|
| |
|
|
|
|
|
| |
| |
 |
|
| |
| Technical Score |
|
Short-Term |
|
|
|
Medium-Term |
|
|
|
Long-Term |
|
|
|
| Quant Rating |
 |
37 |
|
| Weak |
|
|
|
|
|
|
|
|
| |
| |
|
|
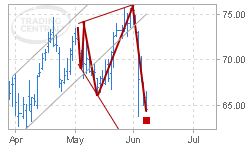
Megaphone Top
| 15% move possible
|
Trading closed at 64.50 to confirm an Intermediate-Term Megaphone Top pattern.
Tells Me: The recent broadening action tells us that trading has been out of control, but a breakout on the downside suggests we're starting a more decisive downtrend.
More Details
|
|
|
|
| |
|
|
| |
|
|
| |
|
|
|
|
|
| |
| |
 |
|
| |
| Technical Score |
|
Short-Term |
|
|
|
Medium-Term |
|
|
 |
Long-Term |
 |
|
|
| Quant Rating |
|
44 |
|
| Weak |
|
|
|
|
|
|
|
|
| |
| |
|
|
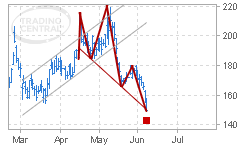
Head and Shoulders Top
| 31% move possible
|
Trading closed at 149.84 to confirm an Intermediate-Term Head and Shoulders Top pattern.
Tells Me: The price seems to have reached the end of a period of "distribution" at the top of a major uptrend; the break down through support signals a reversal to a new downtrend.
More Details
|
|
|
|
| |
|
|
| |
|
|
|
|
|
|
|
| |
Trade ideas are based on Technical Events identified by research provider Trading Central. Every financial instrument is analyzed after every market close to confirm whether a new chart pattern has formed or technical indicator has triggered a signal, giving immediate insight into the possible direction of the price. The analysis is done for you, with full commentary, so you can find out what the price action is telling you.
Technical Score delivers a positive or negative price momentum, for a stock's short- (2 - 6 weeks), medium- (6 weeks - 9 months) and long-term (more than 9 months) outlook, based on the mathematical average of recent technical events. The horizontal bars represent the strength of the bullish and bearish evidence.
TC Quantamental Rating provides compact scores to evaluate a stock across multiple dimensions including three investing styles (Growth, Value, Income) as well as Quality and Momentum.
|
| |
|
|
|
|
|
|
| |
| |
Trading, CFDs, Spread - betting & Options carry risk and could result in the loss of your capital
Ava Trade Markets Ltd is a registered financial services company in the British Virgin Islands and is fully licensed and regulated by the British Virgin Islands Financial Services Commission (No.: SIBA/L/13/1049). Read AvaTrade risk disclosure before trading Forex, CFD's, Spread - betting or FX Options.Forex / CFD, Spread - betting & FX Options trading involves substantial risk of loss and is not suitable for all investors. Copyright © 2007-2021 Ava Trade Markets Ltd. All rights reserved.
TRADING CENTRAL Terms and conditions
The information provided does not constitute, in any way, a solicitation or incentive to buy or sell securities and similar products. Comments and analysis reflect the views of TRADING CENTRAL at any given time and are subject to change at any time. Moreover, they can not constitute a commitment or guarantee on the part of TRADING CENTRAL. The recipient acknowledges and agrees that by their very nature any investment in a financial instrument
is of a random nature and therefore any such investment constitutes a risky investment for which the recipient is solely responsible. It is specified that the past performance of a financial product does not prejudge in any way their future performance. The foreign exchange market and financial derivatives such as futures, CFDs (Contracts for Difference), warrants, turbos or certificates involve a high degree of risk. They require a good level of financial knowledge and experience. TRADING
CENTRAL recommends the consultation of a financial professional who would have a perfect knowledge of the financial and personal situation of the recipient of this message and would be able to verify that the financial products mentioned are adapted to the said situation and the financial objectives pursued. TRADING CENTRAL recommends reading the "risk factors" section of the prospectus for any financial product mentioned.
Some translations have been generated or assisted by
artificial intelligence (AI) tools. While efforts have been made to ensure accuracy and clarity, the translations may not be perfect. Users are encouraged to consult a native speaker or professional translator for critical or sensitive content.
Head of Research at TRADING CENTRAL: Rémy GAUSSENS
TRADING CENTRAL is governed by the code of conduct of the association ANACOFI-CIF, association approved by the Financial Markets Authority and registered with ORIAS under number
17005458.
In the United States, TRADING CENTRAL AMERICAS, INC. is a Registered Investment Adviser (RIA) with the U.S. Securities and Exchange Commission (SEC) under IARD/CRD number 801-67210. Services are provided in the United States by TRADING Central Americas, Inc. TRADING Central will provide a copy of its most recent written disclosure statement without charge upon written request. Notwithstanding the foregoing paragraphs, nothing herein shall constitute a waiver or limitation of
any U.S. person's rights under relevant U.S. federal or state laws.
In Asia, TRADING CENTRAL ASIA LTD has received a license (number AWI815) from the Hong Kong-based Securities and Futures Commission (SFC) to conduct “Type 4” and “Type 5” regulated activities (Advising on Securities and Futures).
TRADING CENTRAL recommends that you read the legal and regulatory information and warnings about the information provided by visiting the following link :
terms_of_use_web_sites_en.pdf
Headquarters of the publisher : TRADING CENTRAL SA, 11 bis rue Scribe, 75009 Paris
RCS : PARIS B 423 512 607 VAT N° FR 174 235 12607
|
| |
|
|
|
|
|
|
| |
| |
| |
AvaTrade
Five Lamps Place
77-80 Amiens St, Dublin 1
DO1A742 Ireland
|
|
|
|
| |
|
|
|
|
 |
|