The ETF Trade Ideas report brought to you by Interactive Brokers and Direxion provides you with trade ideas based on chart patterns automatically detected by Trading Central. These chart patterns are intended as starting points for your own technical analysis, and may help you identify opportunities that make sense for you and your portfolio. Click on the "More Details" link to view the full analysis.
More information on Direxion's products can be found at Direxion.com

|
If you no longer wish to receive this alert via e-mail, you can unsubscribe.
|
|
|
|
|
| |
| |
The ETF Trade Ideas report brought to you by Interactive Brokers and Direxion provides you with trade ideas based on chart patterns automatically detected by Trading Central. These chart patterns are intended as starting points for your own technical analysis, and may help you identify opportunities that make sense for you and your portfolio. Click on the "More Details" link to view the full analysis.
More information on Direxion's products can be found at Direxion.com |
| |
|
|
|
|
|
|
|
| |
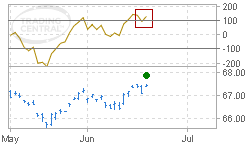
| Vanguard Emerging Markets Government |
|
|
|
|
|
|
| |
|
| |
| |
|
|
Commodity Channel Index
|
Trading closed at 67.44 to confirm a Short-Term Commodity Channel Index pattern.
Tells Me: The price is relatively far from its 20-bar average price.
More Details
|
|
|
|
| |
|
|
| |
|
|
|
|
| |
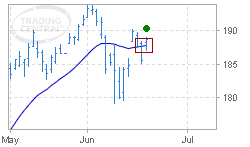
| iShares Core S&P US Growth ETF |
|
|
|
|
|
|
| |
|
| |
| |
|
|
Price Crosses Moving Average
|
Trading closed at 188.68 to confirm a Short-Term Price Crosses Moving Average pattern.
Tells Me: The price is generally in an established trend (bullish or bearish) for the time horizon represented by the moving average period (21, 50 or 200 bars).
More Details
|
|
|
|
| |
|
|
| |
|
|
|
|
| |
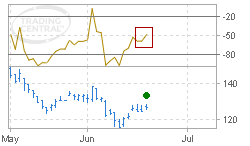
| VanEck Uranium + Nuclear Energy ETF |
|
|
|
|
|
|
| |
|
| |
| |
|
|
Williams %R
|
Trading closed at 126.94 to confirm a Short-Term Williams %R pattern.
Tells Me: For bullish events, we seem to be in a new uptrend now that the price has recovered from oversold (dropped below -80 then rose above). The opposite is true for bearish events where we seem to be in a new downtrend now that the price has recovered from overbought. Meanwhile there is clear evidence that the trend has reversed (continued through the -50 level).
More Details
|
|
|
|
| |
|
|
| |
|
|
|
|
| |
| First Trust RBA American Industrial Renaissance ETF |
|
|
|
|
|
|
| |
|
| |
| |
|
|
MACD
|
Trading closed at 130.90 to confirm a Short-Term MACD pattern.
The MACD (Moving Average Convergence Divergence) plots the difference between a shorter-term (12-bar) and a longer-term (26-bar) exponential moving average (EMA). Bullish and bearish events are generated respectively as the MACD fluctuates above and below zero to indicate whether prices in the shorter term are stronger or weaker than the longer term average.
More Details
|
|
|
|
| |
|
|
| |
|
|
|
|
| |
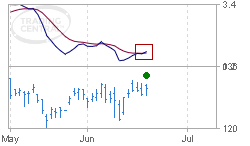
| PIMCO 25+ Year Zero Coupon US Treasury Index Exchange-Traded Fund |
|
|
|
|
|
|
| |
|
| |
| |
|
|
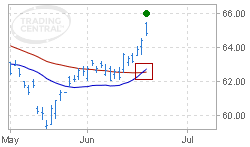
Double Moving Average Crossover
|
Trading closed at 64.82 to confirm a Short-Term Double Moving Average Crossover pattern.
Tells Me: The price is generally in an established trend (bullish or bearish) for the time horizon represented by the moving average periods.
More Details
|
|
|
|
| |
|
|
| |
|
|
|
|
| |
| SPDR Portfolio S&P 1500 Composite Stock Market ETF |
|
|
|
|
|
|
| |
|
| |
| |
|
|
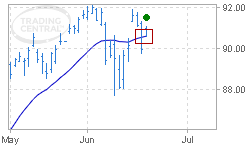
Price Crosses Moving Average
|
Trading closed at 90.91 to confirm a Short-Term Price Crosses Moving Average pattern.
Tells Me: The price is generally in an established trend (bullish or bearish) for the time horizon represented by the moving average period (21, 50 or 200 bars).
More Details
|
|
|
|
| |
|
|
|
|
|
|
|
| |
|
Trade ideas are based on Technical Events identified by research provider Trading Central. Every financial instrument is analyzed after every market close to confirm whether a new chart pattern has formed or technical indicator has triggered a signal, giving immediate insight into the possible direction of the price. The analysis is done for you, with full commentary, so you can find out what the price action is telling you.
|
| |
|
|
|
|
|
|
| |
| |
If you no longer wish to receive this alert via e-mail, you can unsubscribe.
TRADING CENTRAL Terms and conditions
The information provided does not constitute, in any way, a solicitation or incentive to buy or sell securities and similar products. Comments and analysis reflect the views of TRADING CENTRAL at any given time and are subject to change at any time. Moreover, they can not constitute a commitment or guarantee on the part of TRADING CENTRAL. The recipient acknowledges and agrees that by their very nature any investment in a financial instrument
is of a random nature and therefore any such investment constitutes a risky investment for which the recipient is solely responsible. It is specified that the past performance of a financial product does not prejudge in any way their future performance. The foreign exchange market and financial derivatives such as futures, CFDs (Contracts for Difference), warrants, turbos or certificates involve a high degree of risk. They require a good level of financial knowledge and experience. TRADING
CENTRAL recommends the consultation of a financial professional who would have a perfect knowledge of the financial and personal situation of the recipient of this message and would be able to verify that the financial products mentioned are adapted to the said situation and the financial objectives pursued. TRADING CENTRAL recommends reading the "risk factors" section of the prospectus for any financial product mentioned.
Some translations have been generated or assisted by
artificial intelligence (AI) tools. While efforts have been made to ensure accuracy and clarity, the translations may not be perfect. Users are encouraged to consult a native speaker or professional translator for critical or sensitive content.
Head of Research at TRADING CENTRAL: Rémy GAUSSENS
TRADING CENTRAL is governed by the code of conduct of the association ANACOFI-CIF, association approved by the Financial Markets Authority and registered with ORIAS under number
17005458.
In the United States, TRADING CENTRAL AMERICAS, INC. is a Registered Investment Adviser (RIA) with the U.S. Securities and Exchange Commission (SEC) under IARD/CRD number 801-67210. Services are provided in the United States by TRADING Central Americas, Inc. TRADING Central will provide a copy of its most recent written disclosure statement without charge upon written request. Notwithstanding the foregoing paragraphs, nothing herein shall constitute a waiver or limitation of
any U.S. person's rights under relevant U.S. federal or state laws.
In Asia, TRADING CENTRAL ASIA LTD has received a license (number AWI815) from the Hong Kong-based Securities and Futures Commission (SFC) to conduct “Type 4” and “Type 5” regulated activities (Advising on Securities and Futures).
TRADING CENTRAL recommends that you read the legal and regulatory information and warnings about the information provided by visiting the following link :
terms_of_use_web_sites_en.pdf
Headquarters of the publisher : TRADING CENTRAL SA, 11 bis rue Scribe, 75009 Paris
RCS : PARIS B 423 512 607 VAT N° FR 174 235 12607
|
| |
|
|
|
|
|
|
| |
| |
| |
Interactive Brokers Inc.
One Pickwick Plaza
Greenwich, CT 06830 USA
|
|
|
|
| |
|
|
|
|
 |
|