Here's your update on US and Canadian markets, curated by Trading Central expert analysts! These are starting points for your own research to identify opportunities that make sense for you.

|
If you no longer wish to receive this alert via e-mail, you can unsubscribe.
|
|
|
|
|
| |
| |
| Here's your update on US and Canadian markets, curated by Trading Central expert analysts! These are starting points for your own research to identify opportunities that make sense for you. |
| |
|
|
|
|
|
|
|
| |
| Last Price |
Technical Views |
Target |
Pivot |
Technical Views |
Last Price |
|
|
| |
| S&P/TSX 60 (TMX) |
2,129.70 |
|
 |
|
|
|
|
|
|
|
| |
| Dow Jones (CME) |
52,022.00 |
|
|
|
|
|
|
|
|
|
| |
| Nasdaq 100 (CME) |
30,795.50 |
|
|
|
|
|
|
|
|
|
| |
| Russell 2000 (CME) |
2,807.10 |
|
|
|
|
|
|
|
|
|
|
|
|
|
|
|
|
|
|
|
|
|
|
| |
U.S. market futures mostly inch higher before the release of consumer inflation figures for September. Nasdaq futures still underperform.
On Tuesday, major U.S. stock indexes still lacked momentum, with the S&P 500 slipping 1 point (-0.02%) to 7,805, the Nasdaq 100 down 95 points (-0.31%) to 30,569, and the Dow Jones down 180 points (-0.35%) to 51,670.
On the stat front in the U.S. the core inflation rate is expected at 2.5% year-on-year in September vs 2.4% in August.
European indices trade slightly higher.
Asian indices closed mostly red. Regarding stats China's consumer price index edged up to 0.9% year-on-year in September (vs 1.0% expected) from 0.8% a month earlier. Moreover the producer price index rose 5.0%, its fastest pace in over four years, vs 4.5% estimated and 3.8% in August.
WTI crude oil keeps firm, crossing above the 95.00 dollars threshold amid rising tensions in the Middle East.
Gold eases below 4,200 dollars.
Bitcoin consolidates below 84,000 dollars. |
| |
|
|
|
|
|
|
| |
Blackrock (BLK), an investment management firm, jumps as quarterly financial figures topped expectations.
Bank of America (BAC), a banking group, drops as quarterly financial figures missed estimates. Moreover "the U.S. Department of the Treasury announced enforcement actions imposing more than 1.21 billion dollars in penalties against the bank for violations of anti-money laundering and sanctions laws".
GameStop (GME), a video game retailer, gains ground after CEO Ryan Cohen acquired an additional 844,000 shares. |
| |
|
|
|
|
|
|
|
|
| |
Bank Of America (BAC)
Morgan Stanley (MS)
Blackrock (BLK)
Fastenal Co (FAST) |
| |
|
|
|
|
|
|
| |
First Quantum Minerals (FM)', a mining company, target price was raised to 47 dollars from 44 dollars at JPMorgan.
Lundin Mining (LUN)'s, a mining company, target price was raised to 33 dollars from 31 dollars at JPMorgan.
CAE (CAE)'s, a worldwide leader in training for the civil aviation, defence and security, and healthcare markets, target price was cut to 26 dollars from 28 dollars at Jefferies.
TMX Group (X)'s, an integrated exchange group, target price was raised to 65 dollars from 64 dollars at Canaccord Genuity.
Maple Leaf Foods (MFI)', a producer of food products, target price was cut to 29 dollars from 34 dollars at National Bank of Canada.
Enerflex (EFX)'s, a leading provider of modular natural gas, power, and treated water technology solutions, target price was raised to 35 dollars from 33 dollars at RBC.
Goeasy (GSY)'s, a non-prime consumer lender, target price was cut to 47 dollars from 50 dollars at TD Cowen.
Tilray (TLRY)'s, a cannabis pharmaceutical company, target price was cut to 12 dollars from 17 dollars at Jefferies. |
| |
|
|
|
|
|
|
|
|
| |
| No major earnings expected. |
| |
|
|
|
|
|
|
| |
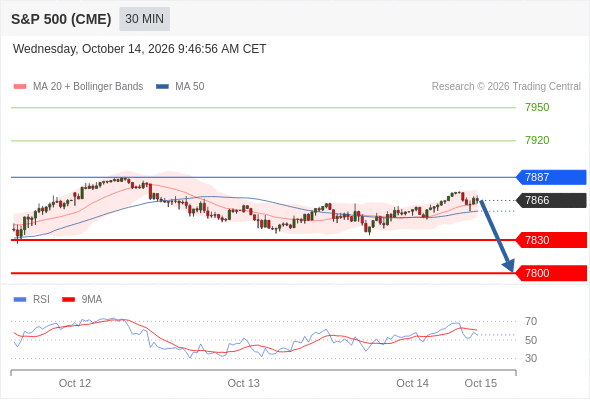
| S&P 500 (CME) (Z6) intraday: key resistance at 7887. |
| |
| Pivot: |
| 7887 |
| |
| Our preference: |
| Short positions below 7887 with targets at 7830 & 7800 in extension. |
| |
| Alternative scenario: |
| Above 7887 look for further upside with 7920 & 7950 as targets. |
| |
| Comment: |
| As long as 7887 is resistance, look for choppy price action with a bearish bias. |
| |
 |
| |
| |
| |
|
|
|
|
|
|
| |
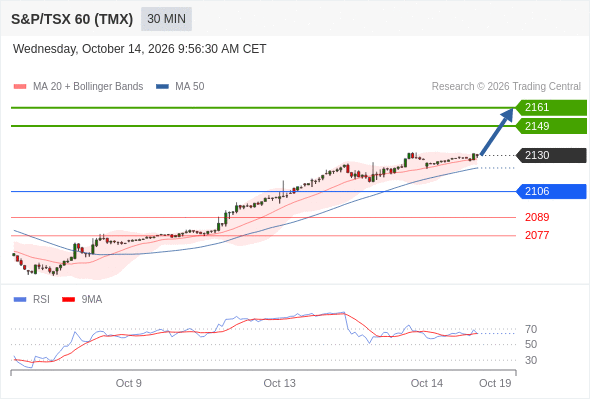
| S&P/TSX 60 (TMX) (Z6) intraday: bullish bias above 2106. |
| |
| Pivot: |
| 2106 |
| |
| Our preference: |
| Long positions above 2106 with targets at 2149 & 2161 in extension. |
| |
| Alternative scenario: |
| Below 2106 look for further downside with 2089 & 2077 as targets. |
| |
| Comment: |
| The RSI is bullish and calls for further advance. |
| |
 |
| |
|
|
|
|
|
|
| |
BULLISH TECHNICAL EVENTS (US) |
|
|
| |
|
|
|
|
| |
| Archer-Daniels-Midland Co |
|
|
|
|
|
|
| |
| |
 |
|
| |
| Technical Score |
 |
Short-Term |
 |
|
 |
Medium-Term |
 |
|
|
Long-Term |
 |
|
|
| Quant Rating |
 |
59 |
|
| Strong |
|
|
|
|
|
|
|
|
| |
| |
|
|
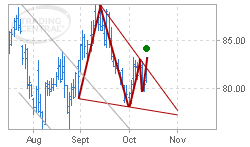
Bottom Triangle
| 13% move possible
|
Trading closed at 83.20 to confirm an Intermediate-Term Bottom Triangle pattern.
Tells Me: The price seems to have reached a bottom, showing signs of reversal as it has broken upward after a period of uncertainty or consolidation.
Read More
|
|
|
|
| |
|
|
| |
|
|
|
|
|
| |
| |
 |
|
| |
| Technical Score |
|
Short-Term |
|
|
|
Medium-Term |
 |
|
|
Long-Term |
|
|
|
| Quant Rating |
|
60 |
|
| Strong |
|
|
|
|
|
|
|
|
| |
| |
|
|
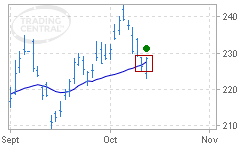
Price Crosses Moving Average
|
Trading closed at 228.52 to confirm a Short-Term Price Crosses Moving Average pattern.
Tells Me: The price is generally in an established trend (bullish or bearish) for the time horizon represented by the moving average period (21, 50 or 200 bars).
Read More
|
|
|
|
| |
|
|
|
|
| |
BULLISH TECHNICAL EVENTS (CA) |
|
|
| |
|
|
|
|
|
| |
| |
 |
|
| |
| Technical Score |
|
Short-Term |
 |
|
|
Medium-Term |
|
|
|
Long-Term |
 |
|
|
| Quant Rating |
|
63 |
|
| Strong |
|
|
|
|
|
|
|
|
| |
| |
|
|
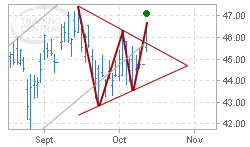
Symmetrical Continuation Triangle (Bullish)
| 10% move possible
|
Trading closed at 46.65 to confirm an Intermediate-Term Symmetrical Continuation Triangle (Bullish) pattern.
Tells Me: The price has broken upward out of a consolidation period, suggesting a continuation of the prior uptrend.
Read More
|
|
|
|
| |
|
|
| |
|
|
|
|
| |
| Rogers Communications Inc |
|
|
|
|
|
|
| |
| |
 |
|
| |
| Technical Score |
|
Short-Term |
 |
|
|
Medium-Term |
 |
|
|
Long-Term |
|
|
|
| Quant Rating |
|
57 |
|
| Strong |
|
|
|
|
|
|
|
|
| |
| |
|
|
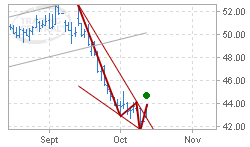
Continuation Wedge (Bullish)
| 25% move possible
|
Trading closed at 43.77 to confirm an Intermediate-Term Continuation Wedge (Bullish) pattern.
Tells Me: After a temporary interruption, the prior uptrend is set to continue.
Read More
|
|
|
|
| |
|
|
|
|
| |
| |
If you no longer wish to receive this alert via e-mail, you can unsubscribe.
The research in this report is not prepared subject to Canadian disclosure requirements.
TRADING CENTRAL Terms and conditions
The information provided does not constitute, in any way, a solicitation or incentive to buy or sell securities and similar products. Comments and analysis reflect the views of TRADING CENTRAL at any given time and are subject to change at any time. Moreover, they can not constitute a commitment or guarantee on the part of TRADING CENTRAL. The recipient acknowledges and agrees that by their very nature any investment in a financial instrument
is of a random nature and therefore any such investment constitutes a risky investment for which the recipient is solely responsible. It is specified that the past performance of a financial product does not prejudge in any way their future performance. The foreign exchange market and financial derivatives such as futures, CFDs (Contracts for Difference), warrants, turbos or certificates involve a high degree of risk. They require a good level of financial knowledge and experience. TRADING
CENTRAL recommends the consultation of a financial professional who would have a perfect knowledge of the financial and personal situation of the recipient of this message and would be able to verify that the financial products mentioned are adapted to the said situation and the financial objectives pursued. TRADING CENTRAL recommends reading the "risk factors" section of the prospectus for any financial product mentioned.
Some translations have been generated or assisted by
artificial intelligence (AI) tools. While efforts have been made to ensure accuracy and clarity, the translations may not be perfect. Users are encouraged to consult a native speaker or professional translator for critical or sensitive content.
Head of Research at TRADING CENTRAL: Rémy GAUSSENS
TRADING CENTRAL is governed by the code of conduct of the association ANACOFI-CIF, association approved by the Financial Markets Authority and registered with ORIAS under number
17005458.
In the United States, TRADING CENTRAL AMERICAS, INC. is a Registered Investment Adviser (RIA) with the U.S. Securities and Exchange Commission (SEC) under IARD/CRD number 801-67210. Services are provided in the United States by TRADING Central Americas, Inc. TRADING Central will provide a copy of its most recent written disclosure statement without charge upon written request. Notwithstanding the foregoing paragraphs, nothing herein shall constitute a waiver or limitation of
any U.S. person's rights under relevant U.S. federal or state laws.
In Asia, TRADING CENTRAL ASIA LTD has received a license (number AWI815) from the Hong Kong-based Securities and Futures Commission (SFC) to conduct “Type 4” and “Type 5” regulated activities (Advising on Securities and Futures).
TRADING CENTRAL recommends that you read the legal and regulatory information and warnings about the information provided by visiting the following link :
terms_of_use_web_sites_en.pdf
Headquarters of the publisher : TRADING CENTRAL SA, 11 bis rue Scribe, 75009 Paris
RCS : PARIS B 423 512 607 VAT N° FR 174 235 12607
|
| |
|
|
|
|
|
|
| |
| |
| |
Questrade, Inc.
5700 Yonge Street, Unit G1 – Ground Floor
Toronto, ON M2M 4K2 Canada
|
|
|
|
| |
|
|
|
|
|
|