|
| |
Market Wrap: pre-opening session |
|
|
| |
|
|
|
| |
U.S. market futures are well oriented as over the weekend, U.S. President Donald Trump said a new round of attacks against Iran will be cancelled subject to a quick deal with Iran.
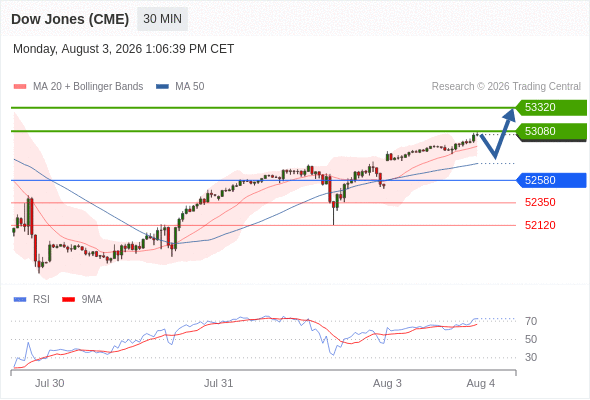
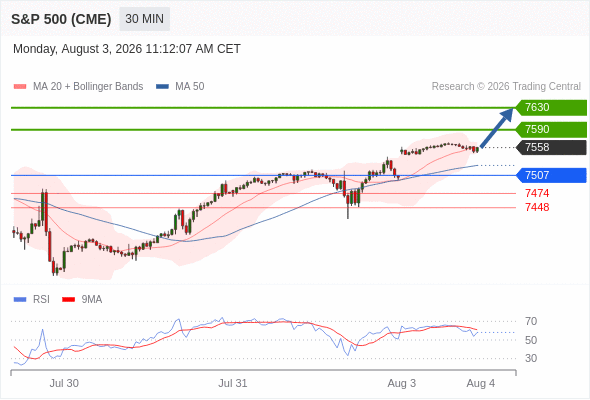
On Friday, major U.S. stock indexes advanced further following a sharp rebound Thursday, with the S&P 500 rising 52 points (+0.70%) to 7,489, the Nasdaq 100 up 168 points (+0.60%) to 28,274, and the Dow Jones up 277 points (+0.53%) to 52,485.
On the stat front, in the U.S., the ISM manufacturing purchasing managers index is expected at 53.7 in July vs 53.3 in June.
Canada stocks markets are closed for Civic Holiday.
European indices trade mostly green with the Germany's DAX 40 posting new record highs. On the stat plan, in Germany, retail sales fell 1.1% month-on-month in June, compared with an expected 0.4% decline, after rising 1.1% the previous month.
Asian indices were mixed. Japan's Finance Ministry said it conducted a coordinated yen-buying operation with the U.S. Treasury on Friday. Regarding stats, China's RatingDog manufacturing purchasing managers index fell to 50.9 in July, below 51.5 expected.
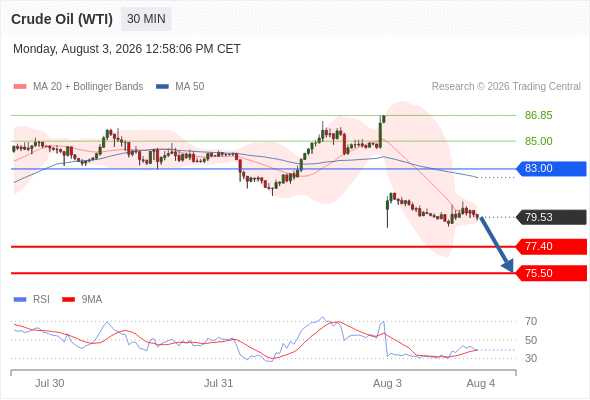
WTI crude oil prices drop, trading around 80 dollars on declining tensions in the Middle East.
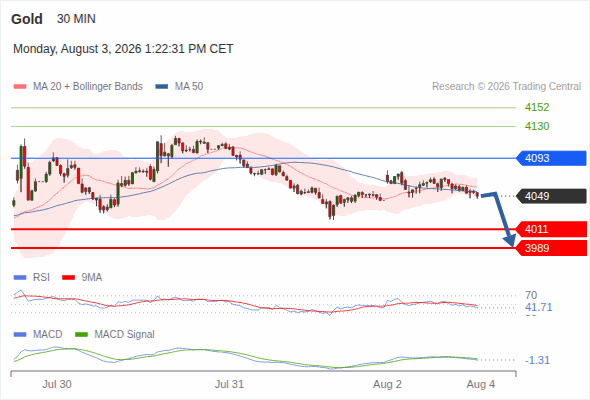
Gold trades sideways still holding the key 4,000 dollars threshold.
Bitcoin consolidates above 62,000 dollars.
|
| |
|
|
|
|
|
|
|
|
| |
Bristol-Myers Squibb (BMY) jumps after the Financial Times reported the pharma company and UK peer AstraZeneca held talks regarding a potential merger.
Micron Technology (MU), a manufacturer of memory chips, loses ground as Reuters reported that China's chipmaker CXMT is weighing plans to build a second memory chip plant in Beijing.
Alibaba (BABA), a Chinese tech giant, is well oriented after unveiling its latest flagship artificial intelligence model.
Ferguson (FERG), North America’s largest value-added distributor of essential water and air solutions, jumps as it will join the S&P 500 index before the open on August 5.
eBay (EBAY), a global electronic commerce platform, was downgraded to "underweight" from "equal weight" at Wells Fargo.
|
| |
|
|
|
|
|
|
|
|
| |
Palantir Technologies Inc (PLTR)
Vertex Pharmaceuticals Inc (VRTX)
Marriott International Inc (MAR)
Williams Companies Inc (WMB)
Diamondback Energy Inc (FANG)
ONEOK Inc (OKE)
ON Semiconductor Corp (ON)
EchoStar Corp (ECHO)
Loews Corp (L)
Tyson Foods Inc (TSN)
|
| |
|
|
|
|
|
|
|
|
| |
Last Friday, the S&P/TSX Composite Index dropped 0.79% to 35,226 and the S&P/TSX 60 Index fell 0.75% to 2,083.
Canada's stock market will be closed for Civic Holiday on Monday.
|
| |
|
|
|
|
|