Here are today's directional views from the global research desks of Ventura Prime FX! These are starting points for your own research to identify opportunities that make sense for you.

|
| |
| DAILY STOCK TECHNICAL NEWSLETTER |
|
|
|
|
|
|
| |
| |
| Here are today's directional views from the global research desks of Ventura Prime FX! These are starting points for your own research to identify opportunities that make sense for you. |
| |
|
|
|
|
|
|
|
| |
| |
 |
|
Please note that due to market volatility, some of the key levels may have already been reached and scenarios played out. |
|
| |
|
|
|
|
|
|
| |
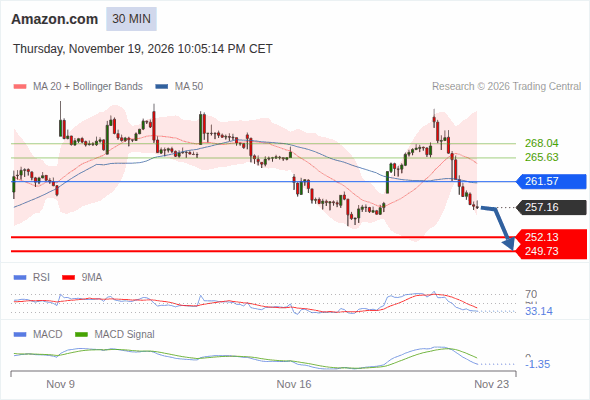
| Amazon.com intraday : The downside prevails as long as 261.57 is resistance |
| |
|
| Our pivot point is at 261.57. |
| |
| Our preference: |
| The downside prevails as long as 261.57 is resistance, with 252.13 and 249.73 as targets |
| |
| Alternative scenario: |
| Above 261.57, look for 265.63 and 268.04. |
| |
| Comment: |
| The RSI is below its neutrality area at 50. The MACD is below its signal line and negative. The configuration is negative. The price stands below its 20 and 50 period moving average (respectively at 264.66 and 261.37). |
| |
 |
| |
|
|
| |
| |
| |
|
|
|
|
|
|
| |
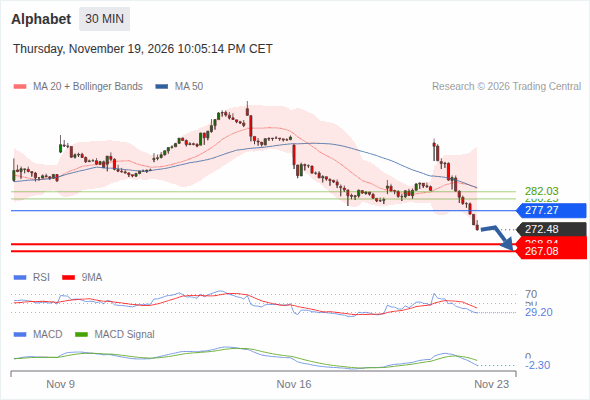
| Alphabet intraday : The downside prevails as long as 277.27 is resistance |
| |
|
| Our pivot point is at 277.27. |
| |
| Our preference: |
| The downside prevails as long as 277.27 is resistance, with 268.84 and 267.08 as targets |
| |
| Alternative scenario: |
| Above 277.27, look for 280.25 and 282.03. |
| |
| Comment: |
| The RSI is below 30. It could either mean that the price is in a lasting downtrend or just oversold and therefore bound to retrace (look for bullish divergence in this case). The MACD is below its signal line and negative. The configuration is negative. The price stands below its 20 and 50 period moving average (respectively at 282.85 and 283.10). |
| |
 |
| |
|
|
| |
| |
| |
|
|
|
|
|
|
| |
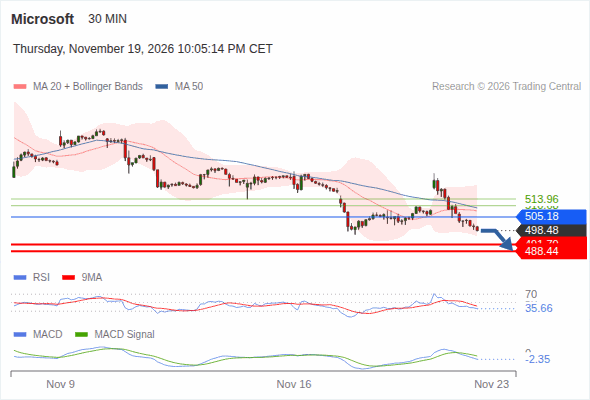
| Microsoft intraday : The downside prevails as long as 505.18 is resistance |
| |
|
| Our pivot point is at 505.18. |
| |
| Our preference: |
| The downside prevails as long as 505.18 is resistance, with 491.70 and 488.44 as targets |
| |
| Alternative scenario: |
| Above 505.18, look for 510.68 and 513.96. |
| |
| Comment: |
| The RSI is below its neutrality area at 50. The MACD is below its signal line and negative. The configuration is negative. The price stands below its 20 and 50 period moving average (respectively at 508.14 and 509.59). |
| |
 |
| |
|
|
| |
| |
| |
|
|
|
|
|
|
| |
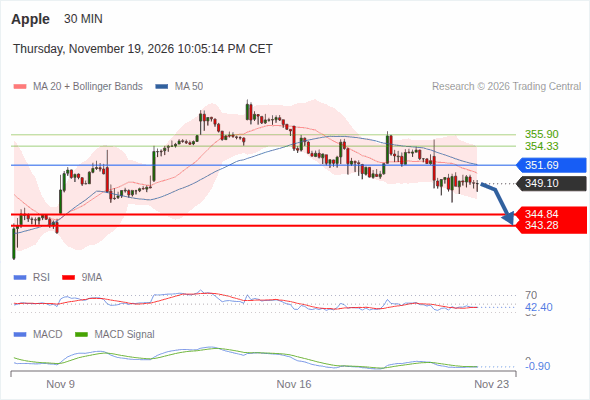
| Apple intraday : The downside prevails as long as 351.69 is resistance |
| |
|
| Our pivot point is at 351.69. |
| |
| Our preference: |
| The downside prevails as long as 351.69 is resistance, with 344.84 and 343.28 as targets |
| |
| Alternative scenario: |
| Above 351.69, look for 354.33 and 355.90. |
| |
| Comment: |
| The RSI is below its neutrality area at 50. The MACD is below its signal line and negative. The configuration is negative. The price stands below its 20 and 50 period moving average (respectively at 350.59 and 351.78). |
| |
 |
| |
|
|
| |
| |
| |
|
|
|
|
|
|
| |
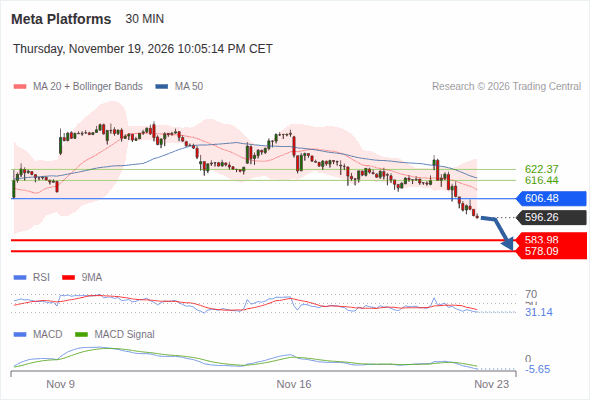
| Meta Platforms intraday : The downside prevails as long as 606.48 is resistance |
| |
|
| Our pivot point is at 606.48. |
| |
| Our preference: |
| The downside prevails as long as 606.48 is resistance, with 583.98 and 578.09 as targets |
| |
| Alternative scenario: |
| Above 606.48, look for 616.44 and 622.37. |
| |
| Comment: |
| The RSI is below its neutrality area at 50. The MACD is below its signal line and negative. The configuration is negative. The price stands below its 20 and 50 period moving average (respectively at 611.35 and 617.76). |
| |
 |
| |
|
|
| |
| |
| |
|
|
|
|
|
|
| |
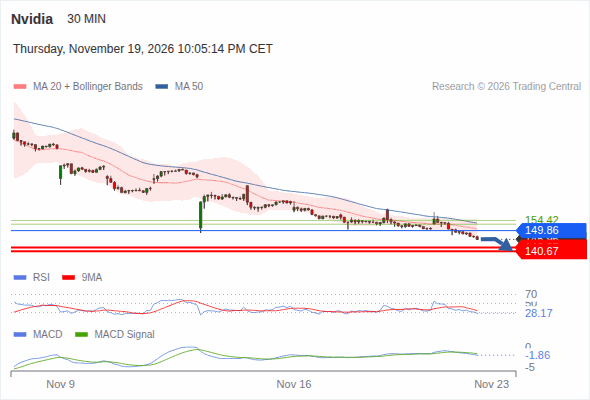
| Nvidia intraday : The downside prevails as long as 149.86 is resistance |
| |
|
| Our pivot point is at 149.86. |
| |
| Our preference: |
| The downside prevails as long as 149.86 is resistance, with 142.35 and 140.67 as targets |
| |
| Alternative scenario: |
| Above 149.86, look for 152.72 and 154.42. |
| |
| Comment: |
| The RSI is below 30. It could either mean that the price is in a lasting downtrend or just oversold and therefore bound to retrace (look for bullish divergence in this case). The MACD is below its signal line and negative. The configuration is negative. The price stands below its 20 and 50 period moving average (respectively at 150.62 and 153.22). |
| |
 |
| |
|
|
| |
|
|
|
|
|
|
| |
| |
TRADING FOREIGN EXCHANGE ON MARGIN CARRIES A HIGH LEVEL OF RISK AND MAY NOT BE SUITABLE FOR ALL INVESTORS.
THE POSSIBILITY EXISTS THAT YOU COULD SUSTAIN A LOSS OF SOME OR ALL OF YOUR INITIAL INVESTMENT AND THEREFORE YOU SHOULD NOT INVEST MONEY THAT YOU CANNOT AFFORD TO LOSE.
THE HIGH DEGREE OF LEVERAGE CAN WORK AGAINST YOU AS WELL AS FOR YOU. BEFORE DECIDING TO TRADE FOREIGN EXCHANGE OR CFD’S YOU SHOULD CAREFULLY CONSIDER YOUR INVESTMENT OBJECTIVES, LEVEL OF EXPERIENCE, AND RISK APPETITE.
YOU SHOULD BE AWARE OF ALL THE RISKS ASSOCIATED WITH FOREIGN EXCHANGE AND OTHER CFD TRADING, AND SEEK ADVICE FROM AN INDEPENDENT FINANCIAL ADVISOR IF YOU HAVE ANY DOUBTS. VPFX RECOMMENDS READING THE RISK DISCLOSURE SECTION OF THE PROSPECTUS FOR ANY FINANCIAL PRODUCT MENTIONED.
VPFX is the trading name for Ventura Prime FX Limited with registration number LL16224 registered in Labuan F.T., Malaysia.
Ventura Prime FX Limited is authorised and regulated by the Labuan Financial Services Authority (LFSA). Registered Address:Kensington Gardens, No U1317, Lot 7616, Jalan Jumidar Buyong, 87000 Labuan Federal Territory, Malaysia
|
| |
|
|
|
|
|